Recent News About Ronks
-

Six accommodation and food services businesses in Lancaster County with between 50 and 99 employees in 2021
There were six accommodation and food services businesses in Lancaster County ZIP Codes with between 50 and 99 employees in 2021, according to County Business Patterns (CBP) statistics provided by the United States Census Bureau.
-

26 accommodation and food services businesses in Lancaster County with between 20 and 49 employees in 2021
There were 26 accommodation and food services businesses in Lancaster County ZIP Codes with between 20 and 49 employees in 2021, according to County Business Patterns (CBP) statistics provided by the United States Census Bureau.
-

29 retail trade businesses in Lancaster County with between 10 and 19 employees in 2021
There were 29 retail trade businesses in Lancaster County ZIP Codes with between 10 and 19 employees in 2021, according to County Business Patterns (CBP) statistics provided by the United States Census Bureau.
-
34 retail trade businesses in Lancaster County with between 5 and 9 employees in 2021
There were 34 retail trade businesses in Lancaster County ZIP Codes with between five and nine employees in 2021, according to County Business Patterns (CBP) statistics provided by the United States Census Bureau.
-
61 retail trade businesses in Lancaster County with fewer than 5 employees in 2021
There were 61 retail trade businesses in Lancaster County ZIP Codes with fewer than five employees in 2021, according to County Business Patterns (CBP) statistics provided by the United States Census Bureau.
-
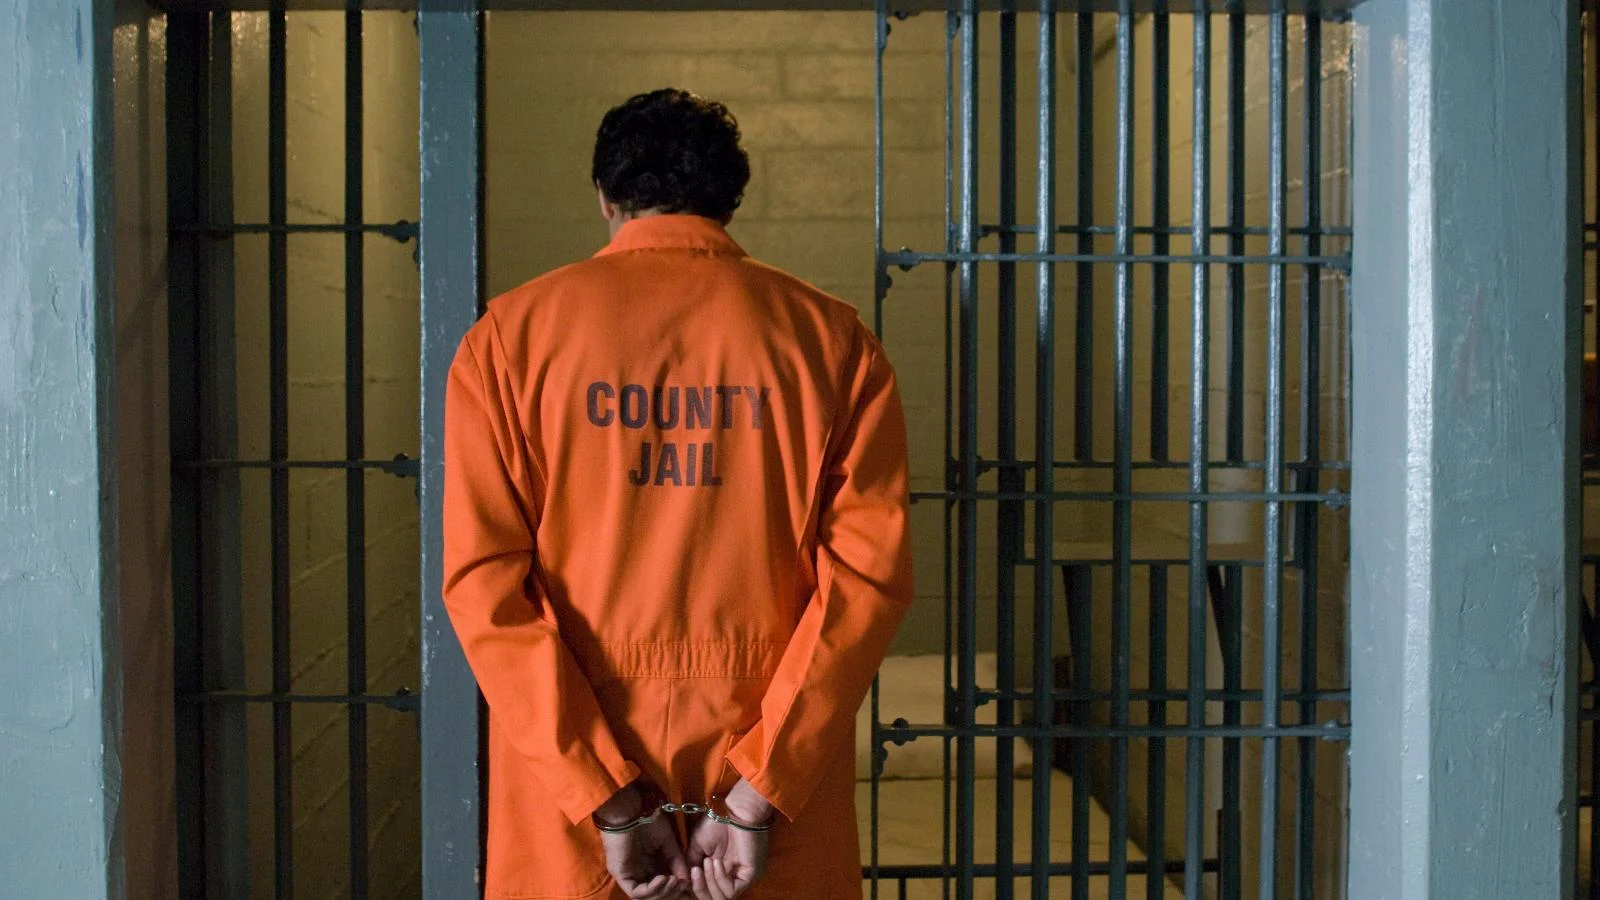
How many White inmates were incarcerated in Lancaster County in Q3 2022?
White is the most common ethnicity among inmates in Lancaster County, according to the Pennsylvania Department of Corrections.
-

388 inmates in Lancaster County are Black in Q3 2022
White is the most common ethnicity among inmates in Lancaster County, according to the Pennsylvania Department of Corrections.
-

How many Asian inmates were incarcerated in Lancaster County in Q3 2022?
White is the most common ethnicity among inmates in Lancaster County, according to the Pennsylvania Department of Corrections.
-
Eight inmates in Lancaster County are of unknown ethnicity in Q3 2022
White is the most common ethnicity among inmates in Lancaster County, according to the Pennsylvania Department of Corrections.
-
How many American Indian inmates were incarcerated in Lancaster County in Q3 2022?
White is the most common ethnicity among inmates in Lancaster County, according to the Pennsylvania Department of Corrections.
-

Census Bureau: 2.5% of people in Lancaster County identified as multi-racial in 2019
Of the 540,999 citizens living in Lancaster County in 2019, 97.5 percent said they were only one race, while 2.5 percent said they were two or more races, according to U.S. Census Bureau data obtained in January.
-

Census Bureau: 76.3 percent of people in Lancaster County were old enough to vote in 2019
Of the 540,999 citizens living in Lancaster County in 2019, 412,824 were old enough to vote as of Jan. 26, according to U.S. Census Bureau data.
-

Voting officials in Lancaster County received grant from Facebook-funded progressives ahead of contentious 2020 US election
Grants from a progressive group funded by Facebook were used by voting officials in Lancaster County to strategically target voters, according to the Centre for Tech and Civic Life (CTCL).
-

34.9 percent of people 25 or older had an associate's degree or higher in Lancaster County
34.9 percent of people 25 years or older had an associate's degree or higher in Lancaster County in 2019, according to data obtained from the U.S. Census Bureau.